Supply Chain Pros Canada

Christina Taylor CSCP
I am a supply chain professional focused on turning complex data into clear, actionable insight. Using tools like Power BI, I help organizations gain visibility, improve performance, and make smarter decisions across their supply chain..
POWER BI
Power BI is a data visualization and analytics tool that turns raw data into interactive dashboards and reports. It brings information from multiple sources into one clear view, helping teams quickly understand performance, spot trends, and make better decisions based on real-time insight.

Power BI Sample Projects
These sample Power BI project demos are personally built by me and reflect real-world supply chain scenarios.
They show how I structure data, design KPIs, and create clear, interactive dashboards that turn complex information into practical, decision-ready insight.
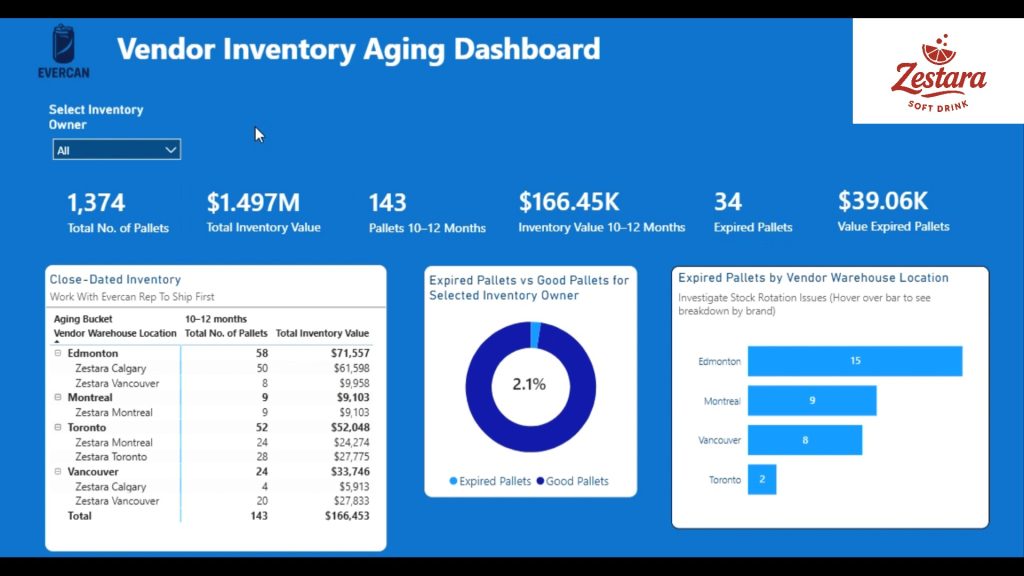
Vendor‑Held Inventory Dashboard
Transforming raw operational data into actionable inventory intelligence.
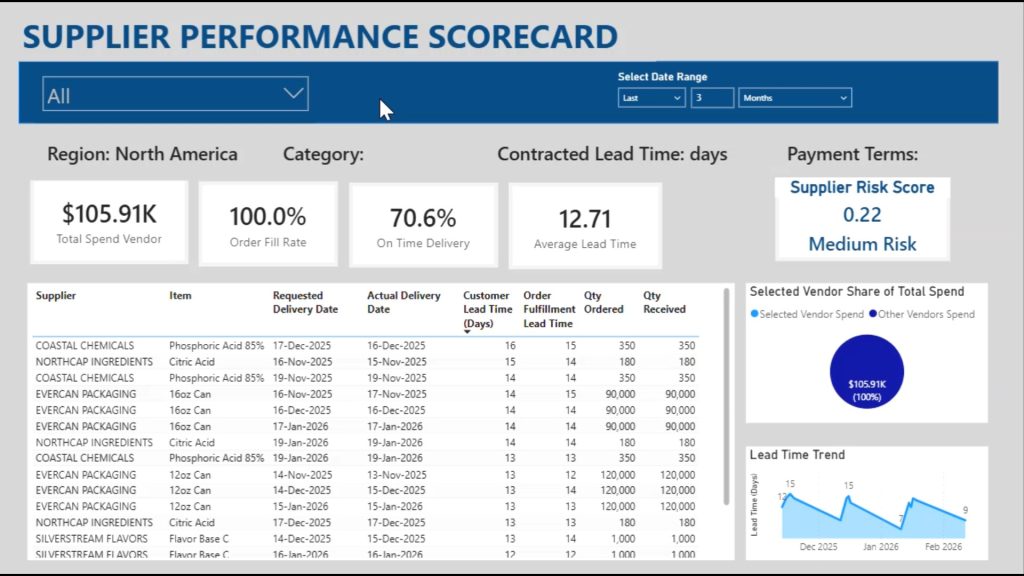
ERP Data into Strategic Vendor Intelligence
Transform transactional ERP data into an integrated vendor performance dashboard.

Project In Progress
The use cases for Power BI.
Frequently Asked Questions
What type of supply chain work do you specialize in?
I focus on turning messy supply chain data into clear, decision-ready insights. My background spans demand planning, inventory optimization, and performance reporting, with a strong emphasis on analytics, visualization, and practical execution—not theory
How do you use Power BI in supply chain projects?
Power BI is my primary tool for building interactive dashboards that connect data across ERP systems, spreadsheets, and external sources. I use it to track KPIs like inventory turns, service levels, forecast accuracy, and supplier performance—so teams can spot issues quickly and act with confidence
Who do you typically work with?
I work with operations leaders, supply chain managers, and small to mid-sized businesses that want better visibility into their data. Whether you’re scaling, troubleshooting inefficiencies, or preparing for growth, my goal is to give you clarity without adding complexity.
What makes your approach different?
I bridge the gap between data and real-world operations. I don’t just build dashboards—I make sure the numbers tell a story people actually understand and use. The focus is always on practical insights, simple visuals, and decisions that move the business forward.